Collaboratory on Economic, Demographic, and Policy Studies
Overview
Since NTID opened its doors in 1968, the proportion of deaf and hard-of-hearing students in the U.S. attending college has quadrupled from about 12 percent of the deaf and hard-of-hearing college age population in 1972 to 47 percent in 2010.
However, beyond NTID graduates, little is known nationally about the effect this access to postsecondary education has had on the occupational status of persons who are deaf or hard of hearing. Answers to such questions guide the research to be pursued through the NTID Collaboratory on Economic, Demographic and Policy Studies.
Beginning with the role RIT/NTID has had in the lives of its alumni, the Collaboratory seeks to describe the demographic and economic conditions of the deaf and hard-of-hearing population of the United States, with emphasis on the impact education has on improving these conditions. Initially, projects will use administrative data from the Social Security Administration, the Bureau of the Census, and the Department of Education to define the status of the population of deaf and hard-of-hearing people in the United States, and will seek to collaborate with other organizations to meet its goals. Reports from these projects will be available on this site in addition to statistics about the demographic, economic, occupational, and NTID alumni status of persons who are deaf or hard of hearing.
Demographics
Demographics of Persons who are Deaf or Hard of Hearing (D/HH)
The most recent estimate of the number of deaf and hard of hearing persons in the United States and related demographics is based on the 2011 American Community Survey (ACS). According to the ACS data, about 3.6 percent of the U.S. population, or about 11 million individuals, consider themselves deaf or have serious difficulty hearing. This section provides information about the relative size of the D/HH population. In addition, the age distribution, gender make up, and ethnic proportions are also included. Finally, the educational attainments of the D/HH population are compared with the hearing population.
Numbers of D/HH Persons as a proportion of the U.S. population: 2011
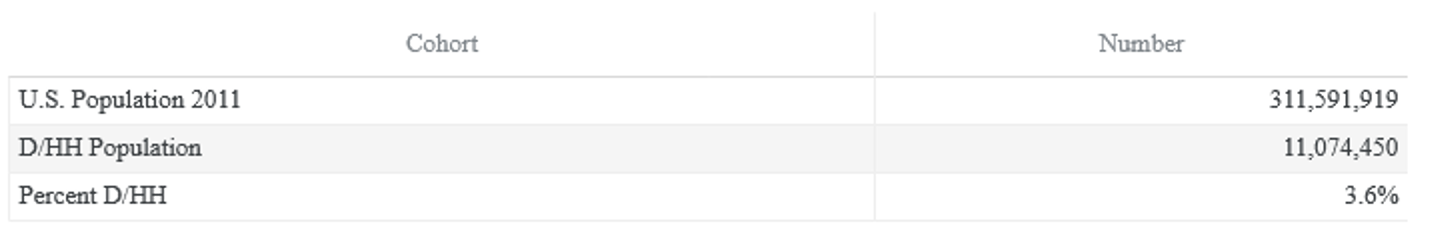
Source: 2011 American Community Survey public use data sample. Data analysis conducted using DataFerrett.
Comments: The 2011 ACS asked whether a person is deaf or has serious difficulty hearing. The results show that about 11 million individuals or 3.6 percent of the US population have some difficulty hearing.
Percentage distribution of the U.S. D/HH population by age: 2011
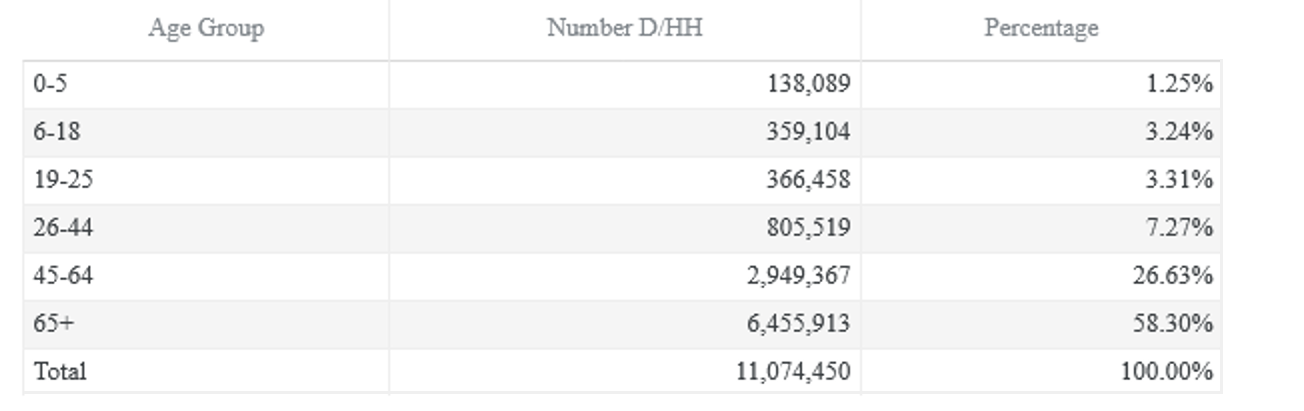
Source: 2011 American Community Survey public use data sample. Data analysis conducted using DataFerrett.
Comments: Results from the 2011 American Community Survey show that the majority of the more than 11 million D/HH individuals are 65 years of age or older. Only about 4.5 percent are under 18 years of age, and 366,458 individuals are between 19 and 25.
Proportion of Hearing and D/HH Males and Females in the U.S. Population: 2011
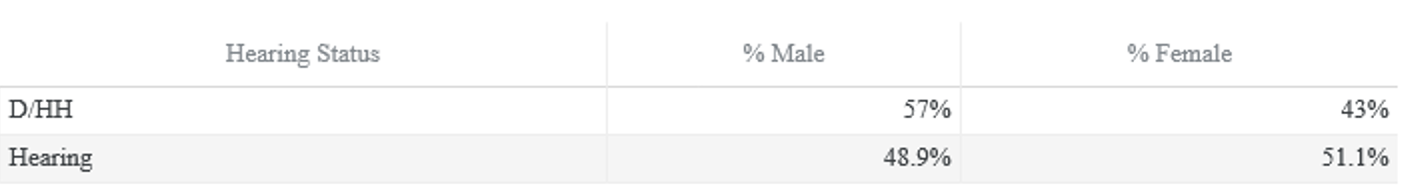
Source: 2011 American Community Survey public use data sample. Data analysis conducted using DataFerrett.
Comments: Estimates from the American Community Survey indicate that there is a significantly higher percentage of males in the D/HH population than there are males in the hearing population of the United States. Almost 57 percent of the D/HH population are males, compared to only 49 percent of the hearing population. Increased prevalence rates in favor of males has been reported in previous studies as far back as Fraser,1964 and Schein,1973.
Proportion of Hearing and D/HH persons by ethnic affiliation: 2011
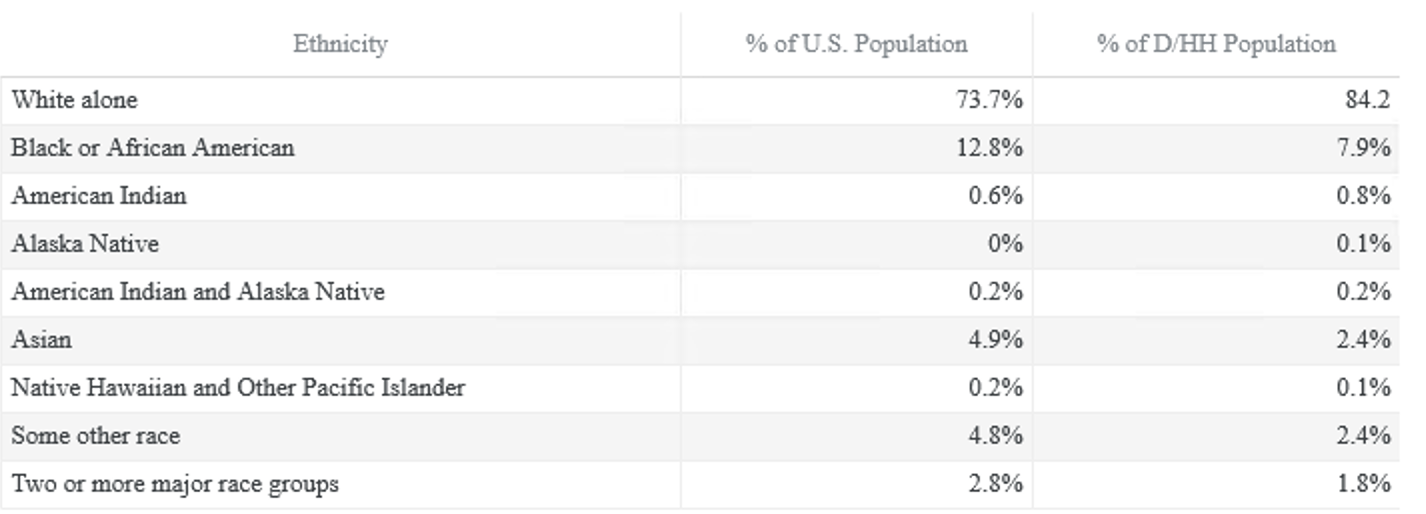
Source: 2011 American Community Survey public use data sample. Data analysis conducted using DataFerrett.
Comments: Estimates from the American Community Survey indicate that there are significantly fewer Blacks or African Americans who are D/HH than would be expected from the distribution of the general population. Abouit 8 percent of the D/HH population are Black or African American, compared to almost 13 percent of the hearing population. Similar differences have been found in repeated studies. Schein (1974) concludes that "most probably the white-nonwhite differences in rates for hearing impairment and deafness are the resultant of several factors -- underenumeration, genetics, and socioeconomic conditions".
Highest education attained by persons ages 26-64 by hearing level.
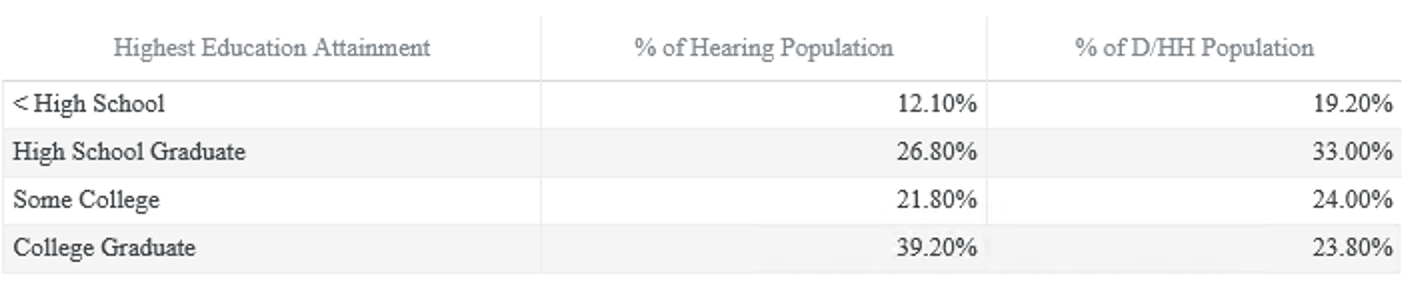
Source: 2011 American Community Survey public use data sample. Data analysis conducted using DataFerrett.
Comments: As a group, persons who are D/HH are less educated than their hearing peers. More than 50 percent of D/HH persons have attained only a high school or less than high school education compared to only 40 percent for hearing persons. Twenty-four percent of those who are D/HH are college graduates compared with 39 percent for the hearing population.
Economics
Economic status of individuals who are D/HH
There is a vast literature available about the benefits of college graduation for the general poplulation. An excellent summary of this research can be found in Education Pays published by the College Board. However, little information can be found in the literature about the benefits of education for individuals who are deaf or hard of hearing. Data reported in this section are from the 2011 American Community Survey(ACS). The ACS is a nationwide survey designed to provide communities a fresh look at how they are changing. Since the ACS includes a variable about hearing, it can be used to assess the economic status of individuals who are D/HH. Data in this section include Earnings by Education, Labor Force Participation Rate, Unemployment Rate, and Social Security Disability Insurance (SSDI).
Average earnings of D/HH persons, age 26-64, by highest education attained.
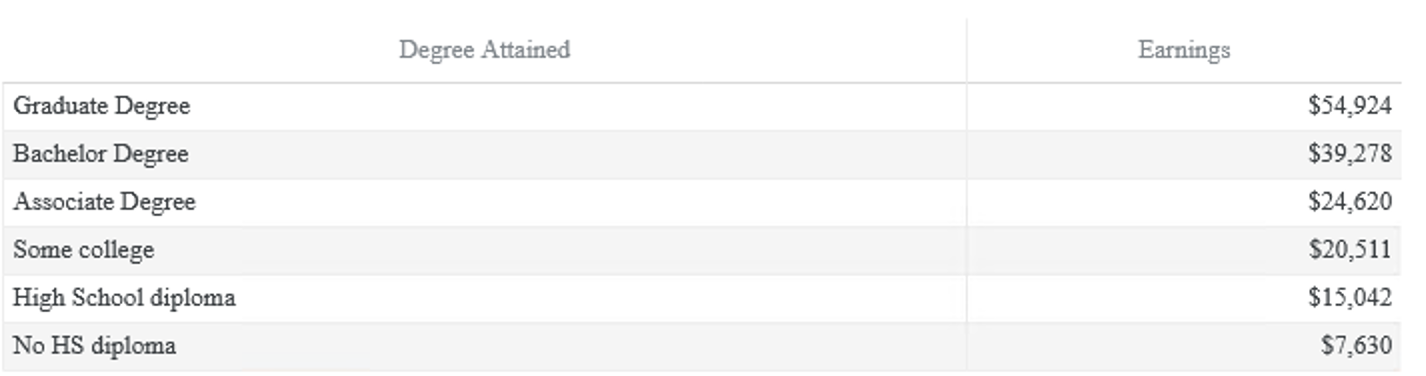
Source: 2011 American Community Survey public use data sample. Data analysis conducted using DataFerrett.
Comments: Data from the 2011 American Community Survey show that education has a significant impact on earnings for D/HH persons. The higher the education attained, the greater the average earnings. Individuals with a college degree earn, depending on the level of attainment, from two to three times more than individuals with only a high school diploma.
Percent of D/HH persons, age 26-64, who are in the labor force by highest education attained.
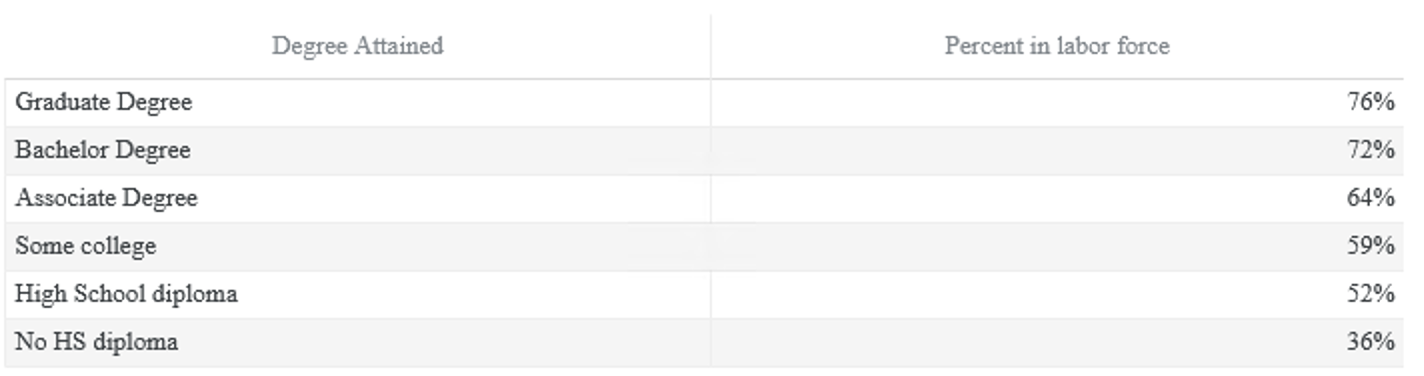
Source: 2011 American Community Survey public use data sample. Data analysis conducted using DataFerrett.
Comments: Data from the 2011 American Community Survey show that education has a significant impact on labor force participation for D/HH persons. About three quarters of individuals between the ages of 25 and 64 who have earned a bachelor's degree or higher participated in the labor force, while only about a third of those with less than a high school diploma participated.
Percent of D/HH persons, age 26-64, who are unemployed by highest education attained.
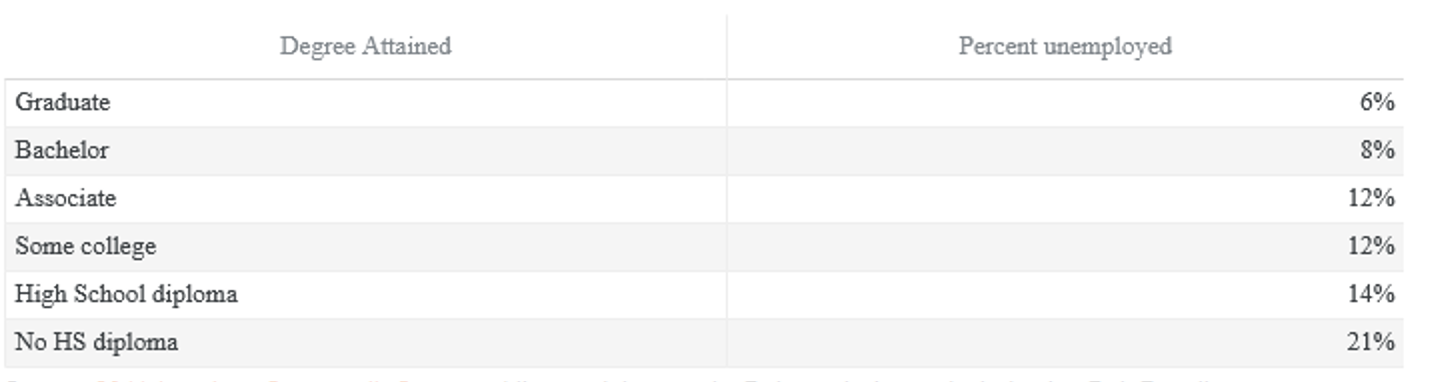
Source: 2011 American Community Survey public use data sample. Data analysis conducted using DataFerrett.
Comments: Data from the 2011 American Community Survey show that education has a significant impact on reducing unemployment. The unemployment rate for D/HH individuals with a bachelor's degree or higher was 8 percent or less, while the rate tended to be greater than 20 percent for those with less than a high school diploma. This at a time when the national average was over eight percent.
Percent of D/HH persons, ages 25 to 64, who are receiving SSDI payments by highest education attained
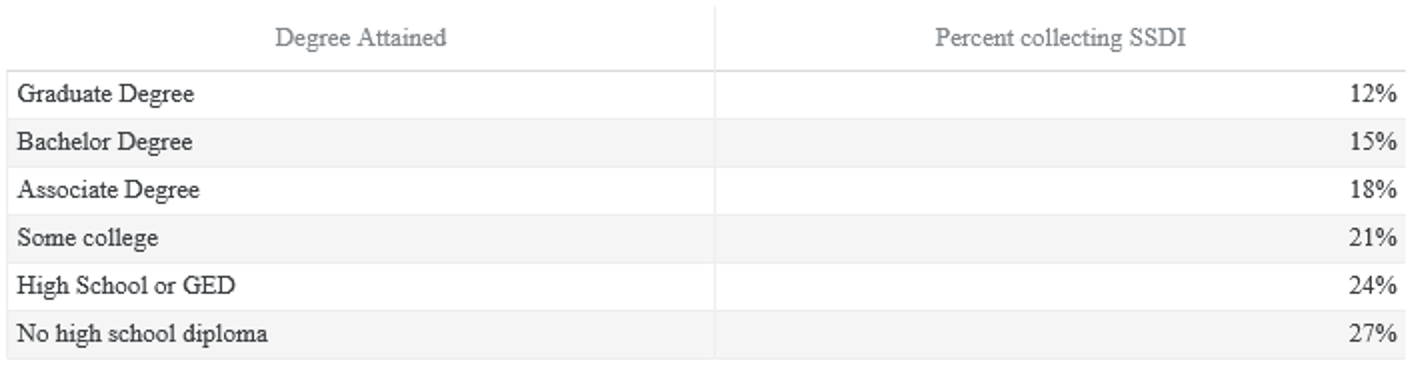
Source: 2011 American Community Survey public use data sample. Data analysis conducted using DataFerrett.
Comments: Data from the 2011 American Community Survey show that about one fifth of D/HH individuals between 26 and 64 were receiving SSDI benefits that averaged more than $11,000 per year. It also demonstrates that education has a significant impact on reducing participation in the Social Security Disability Insurance (SSDI) program. The SSDI participation rate for D/HH individuals with a bachelor's degree or higher was about half that for individuals with no college degree.
Occupations
Occupations of workers who are deaf or hard of hearing
The 2011 Standard Occupational Classification (SOC) system is used by Federal statistical agencies to classify workers into occupational categories for the purpose of collecting, calculating, or disseminating data. All workers are classified into a detailed occupation according to their occupational definition. To facilitate classification, specific occupations are combined to form more than 400 detailed occupations, and then 23 major occupational groups. Detailed occupations in the SOC with similar job duties, and in some cases skills, education, and/or training, are grouped together. Data available from the American Community Survey permit the user to compare the percentages of persons who are deaf or hard of hearing in a specific job or job category with the percentage of hearing persons in the same area. On these pages you have a choice of browsing through the alphabetical list of Occupations or the list of Occupational Categories.
NTID Alumni
Employment status of NTID Alumni through 2011
For almost 30 years the National Technical Institute for the Deaf (NTID) has collaborated first with the Internal Revenue Service and, during the past two decades, with the Social Security Administration (SSA) to conduct analysis of the employment status and earnings of its alumni. The goal of these studies has been to document the impact it has on the individuals who attend NTID.
These studies have demonstrated that an NTID education has significant economic benefits for graduates and effectively reduces the social cost of providing support for these disabled individuals. Conducted in collaboration with the SSA, the pages in this section report on the impact an NTID education has on the employment status, earnings, Supplemental Security Income (SSI), and Social Security Disability Insurance (SSDI) participation of its alumni through 2011.
The SSA followed strict confidentiality guidelines in providing NTID with information. No data about individuals who made up the pool of subjects were reported. NTID made no requests of individuals to furnish any information and no personal information on individuals by way of name or address was used in data analysis. The SSA makes disclosure of grouped information to RIT under authority found in the Privacy Act of 1974 as amended by U.S.C. Section 552a (b)(5): Section 552a (b)(5) states that disclosures may be made to a recipient who has provide the agency with advance adequate written assurance that the record will be used solely as a statistical and reporting record, and the record is to be transferred in a form that is not individually identifiable.
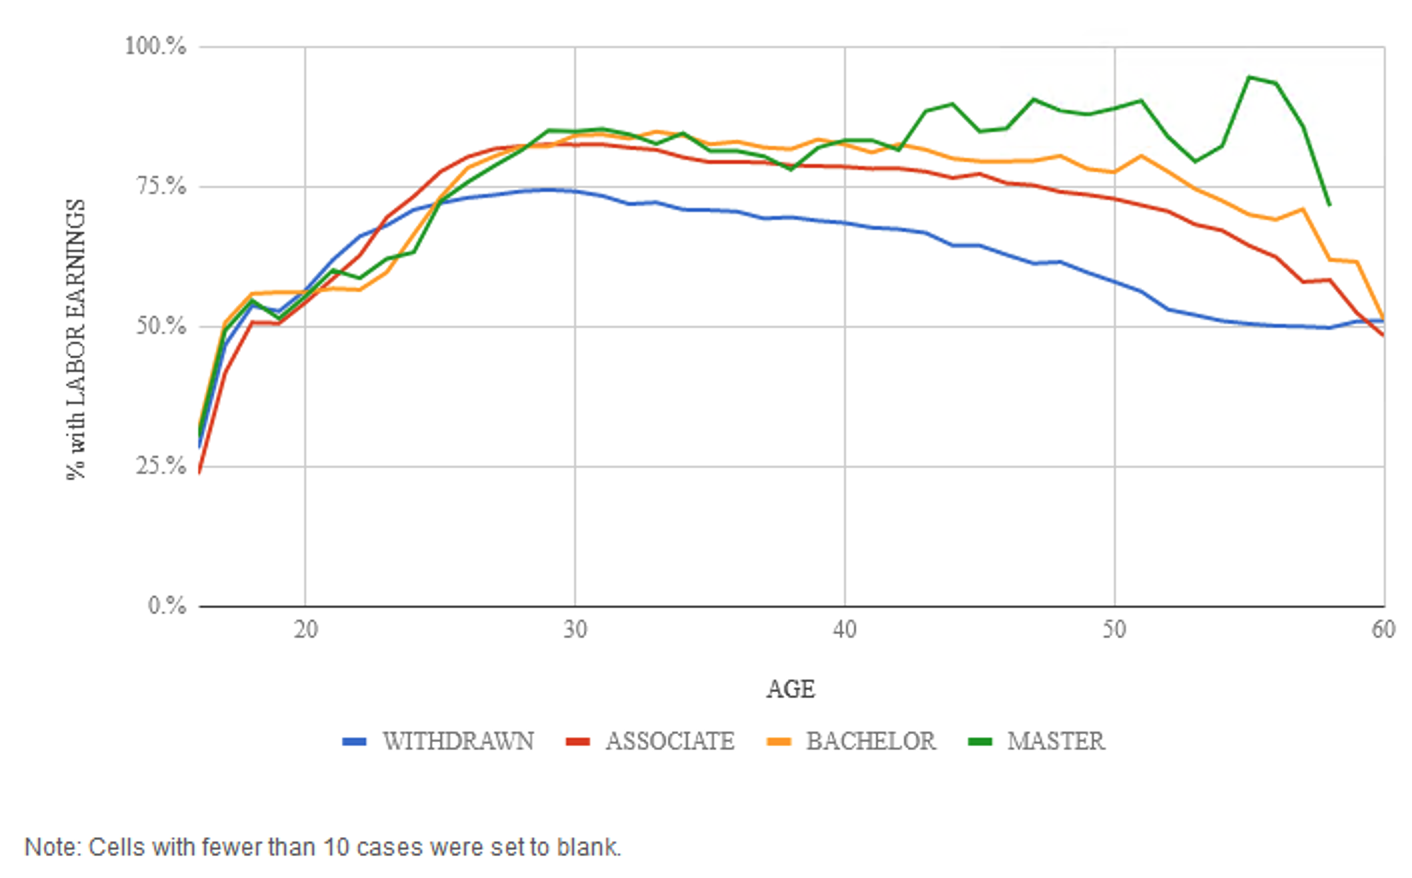
Percentage of Deaf RIT/NTID Alumni Reporting Labor Earnings by Age and Graduation Status
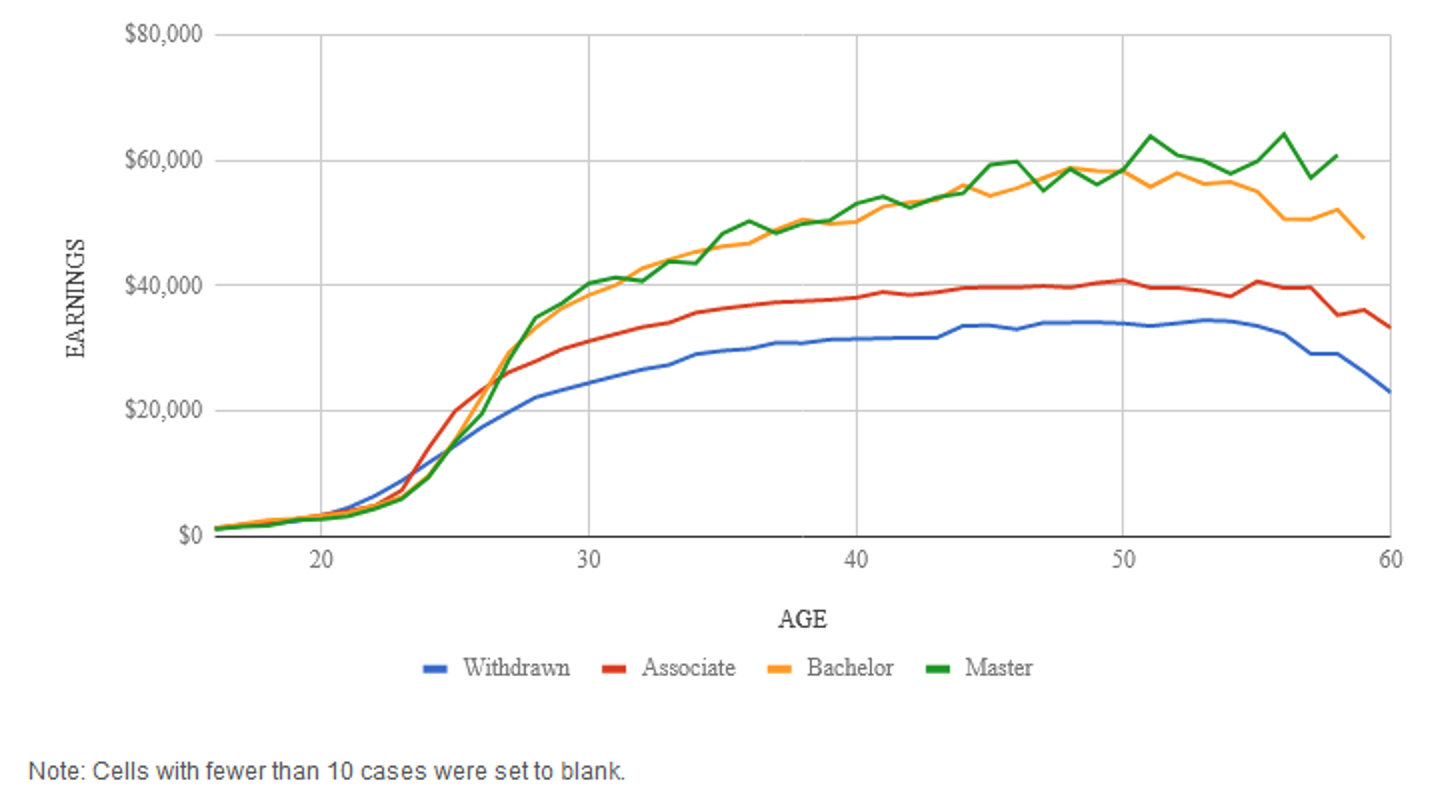
Median Labor Earnings of Deaf RIT/NTID Alumni by Age and Graduation Status: 2011 Dollars
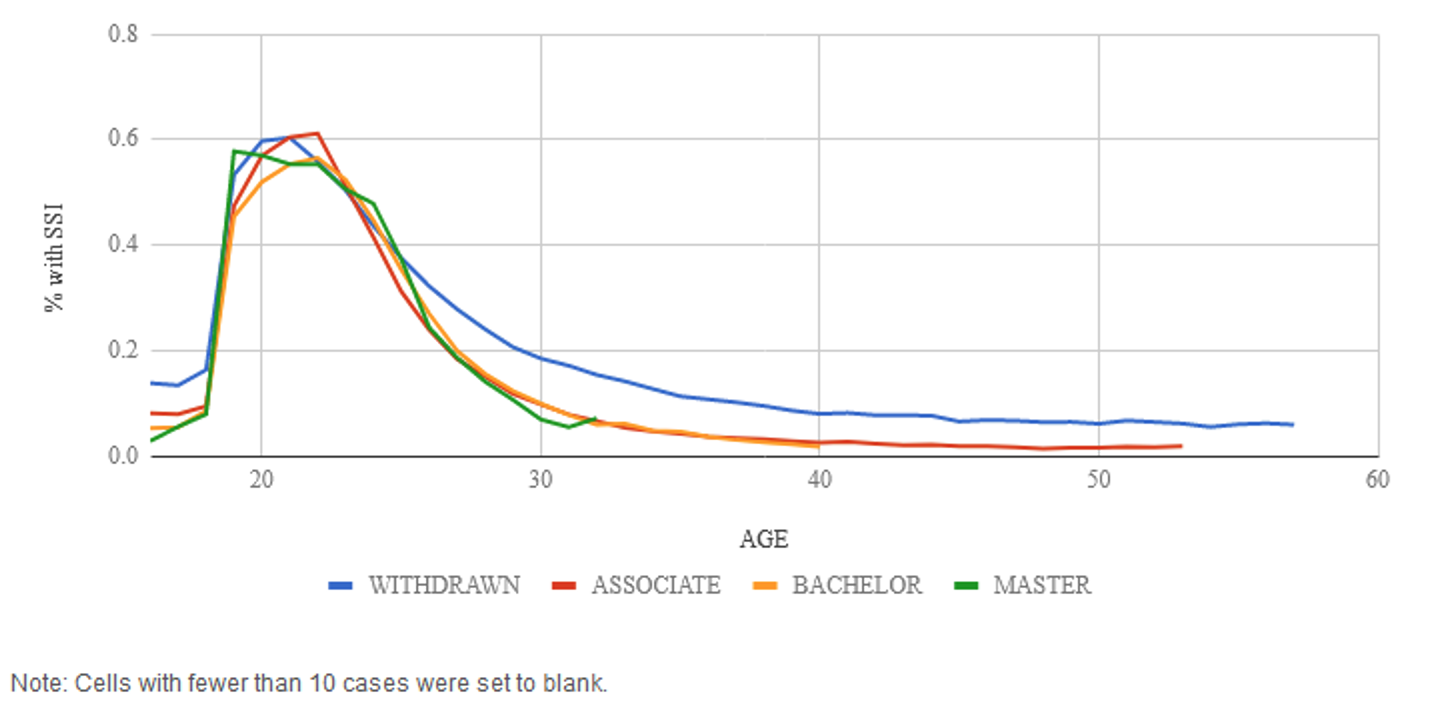
Percentage of Deaf RIT/NTID Alumni receiving Supplemental Security Income ( SSI) payments by Age and Graduation Status
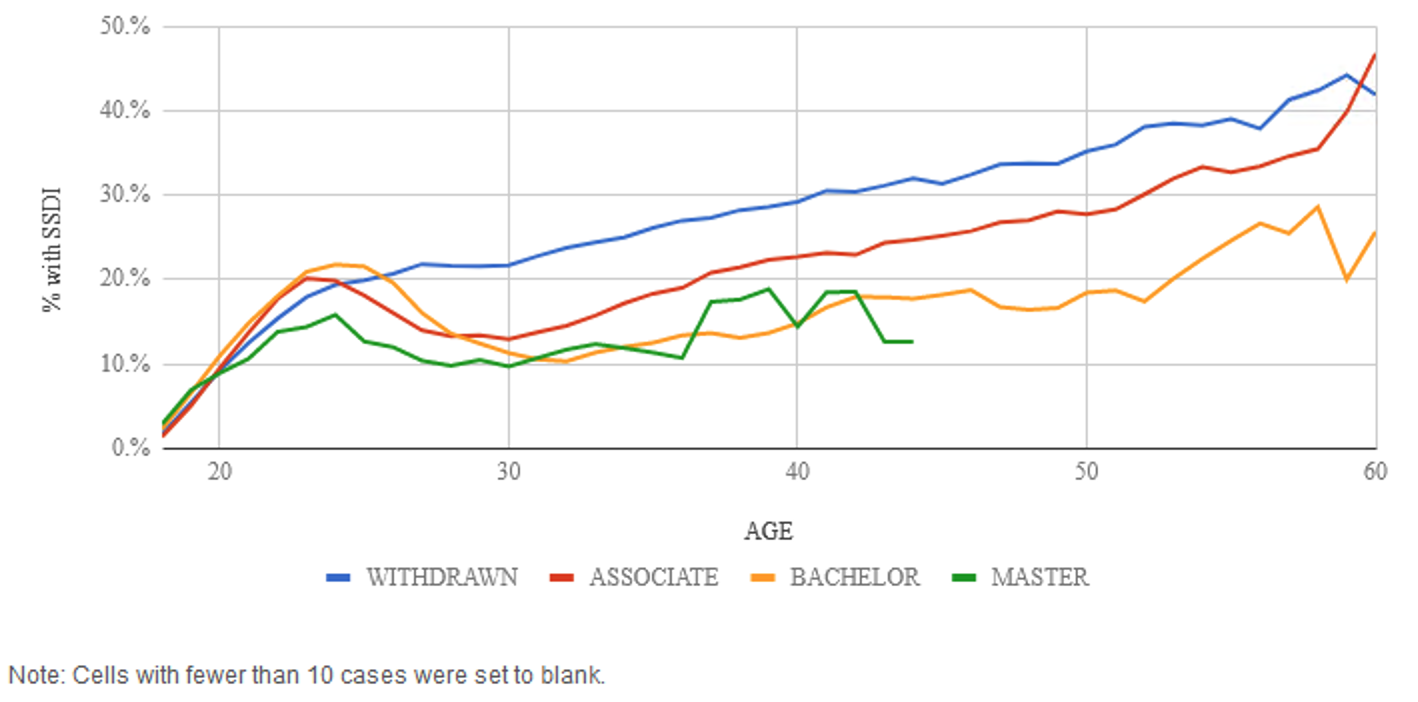
Percentage of Deaf RIT/NTID Alumni receiving Social Security Disability Insurance (SSDI) payments by Age and Graduation Status
Reports
- Schley, S., Walter, G., Weathers, R., Hemmeter, J., Hennessey, J., & Burkhauser, R. (February 2, 2011). Effect of postsecondary education on the economic status of persons who are deaf or hard of hearing, Journal of Deaf Studies and Deaf Education. View
- Weathers, R., Walter, G., Schley, S., Hennessey, J., Hemmeter, J. & Burkhauser, R., (2007). How Postsecondary Education Improves Adult Outcomes for Supplemental Security Income Children with Severe Hearing Impairments. Social Security Bulletin. 67 (2), 101-131. View
- Walter, G., (2010). D/HH students in Transition: Demographics with an emphasis on STEM education. Rochester, NY: National Technical Institute for the Deaf, Rochester Institute of Technology. View
- Walter, G. & Dirmyer, R. (2012). Number of Persons who are Deaf or Hard of Hearing: Rochester, NY, 2010. Rochester, NY: National Technical Institute for the Deaf, Rochester Institute of Technology. View.
- Walter, G. & Dirmyer, R. (2012). The Effect of Education on the Occupational Status of Deaf and Hard-of-Hearing 26-64 Year Olds. Rochester, NY: National Technical Institute for the Deaf, Rochester Institute of Technology. View
- Dirmyer, R. & Walter, G. (2013). Economic Benefits of Completing a Degree from the National Technical Institute for the Deaf. Rochester, NY: National Technical Institute for the Deaf, Rochester Institute of Technology. View
Contacts
For more information contact:
Bernard R. Hurwitz, J.D.
Executive Assistant to the President of NTID at RIT
National Technical Institute for the Deaf
Rochester Institute of Technology
(585)354-8396 (Cell)
bhurwitz@ntid.rit.edu